Pilot 2: Biodiversity
Monitoring and optimization of habitat connectivity
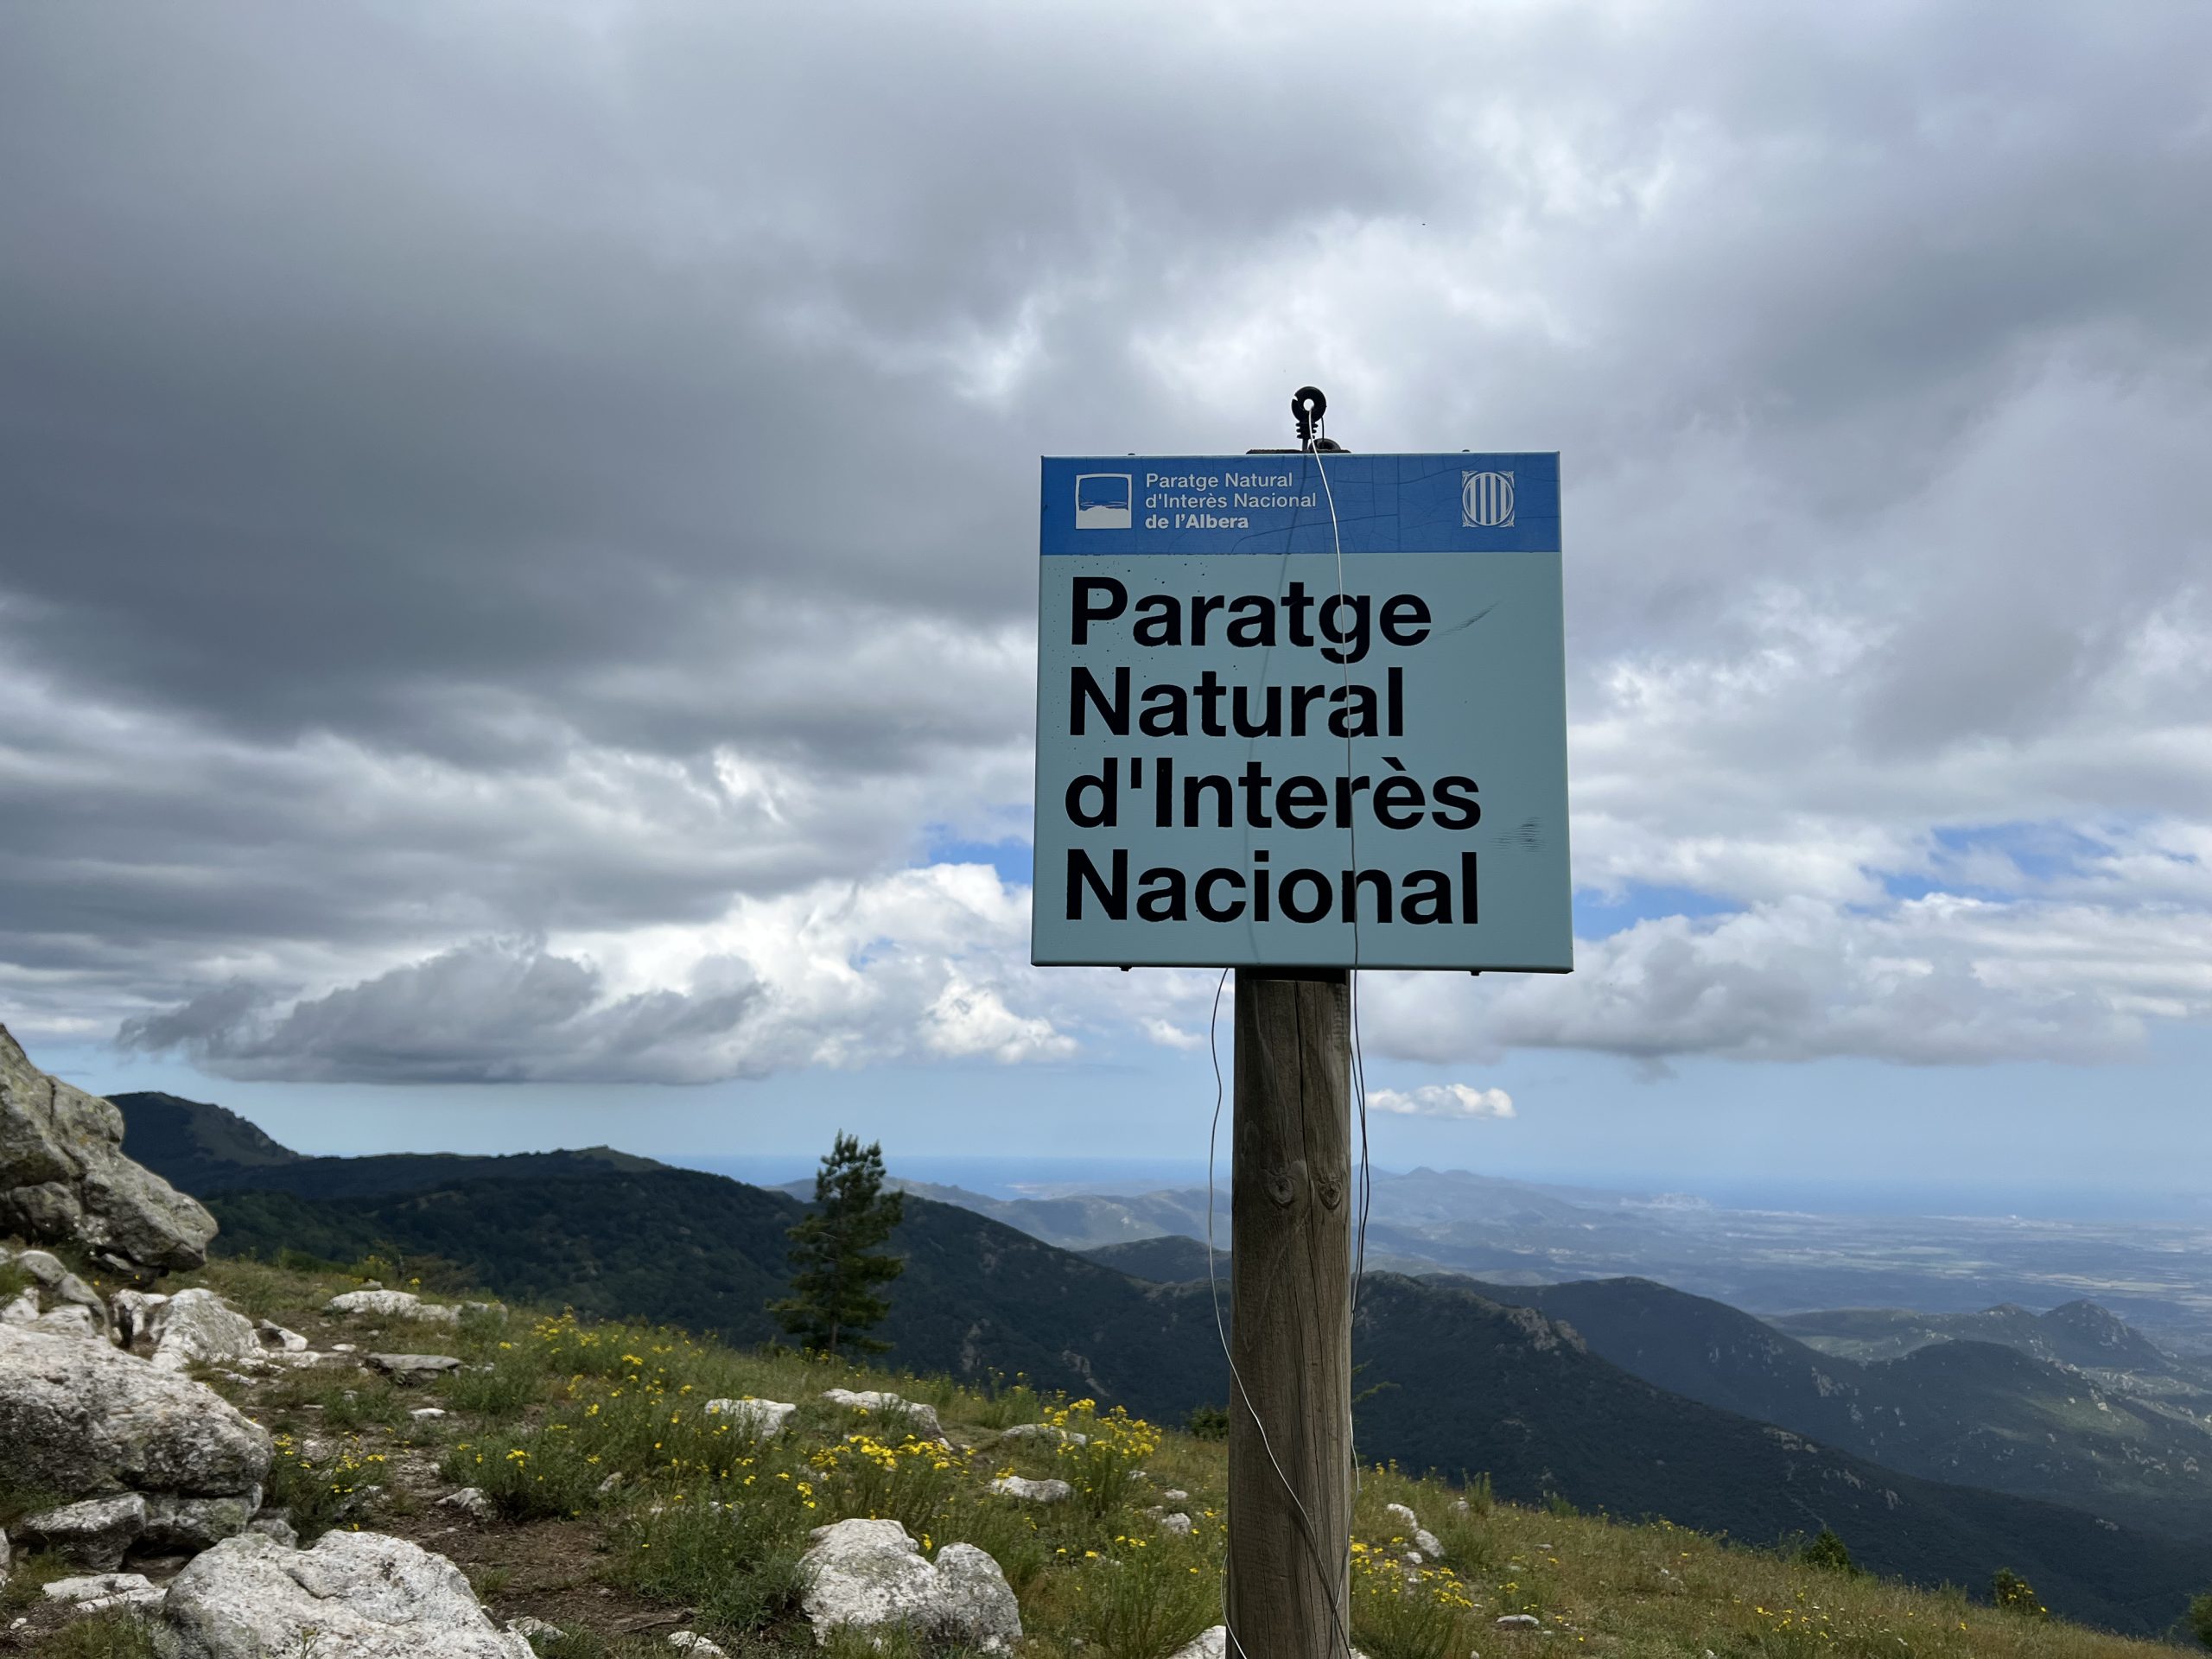
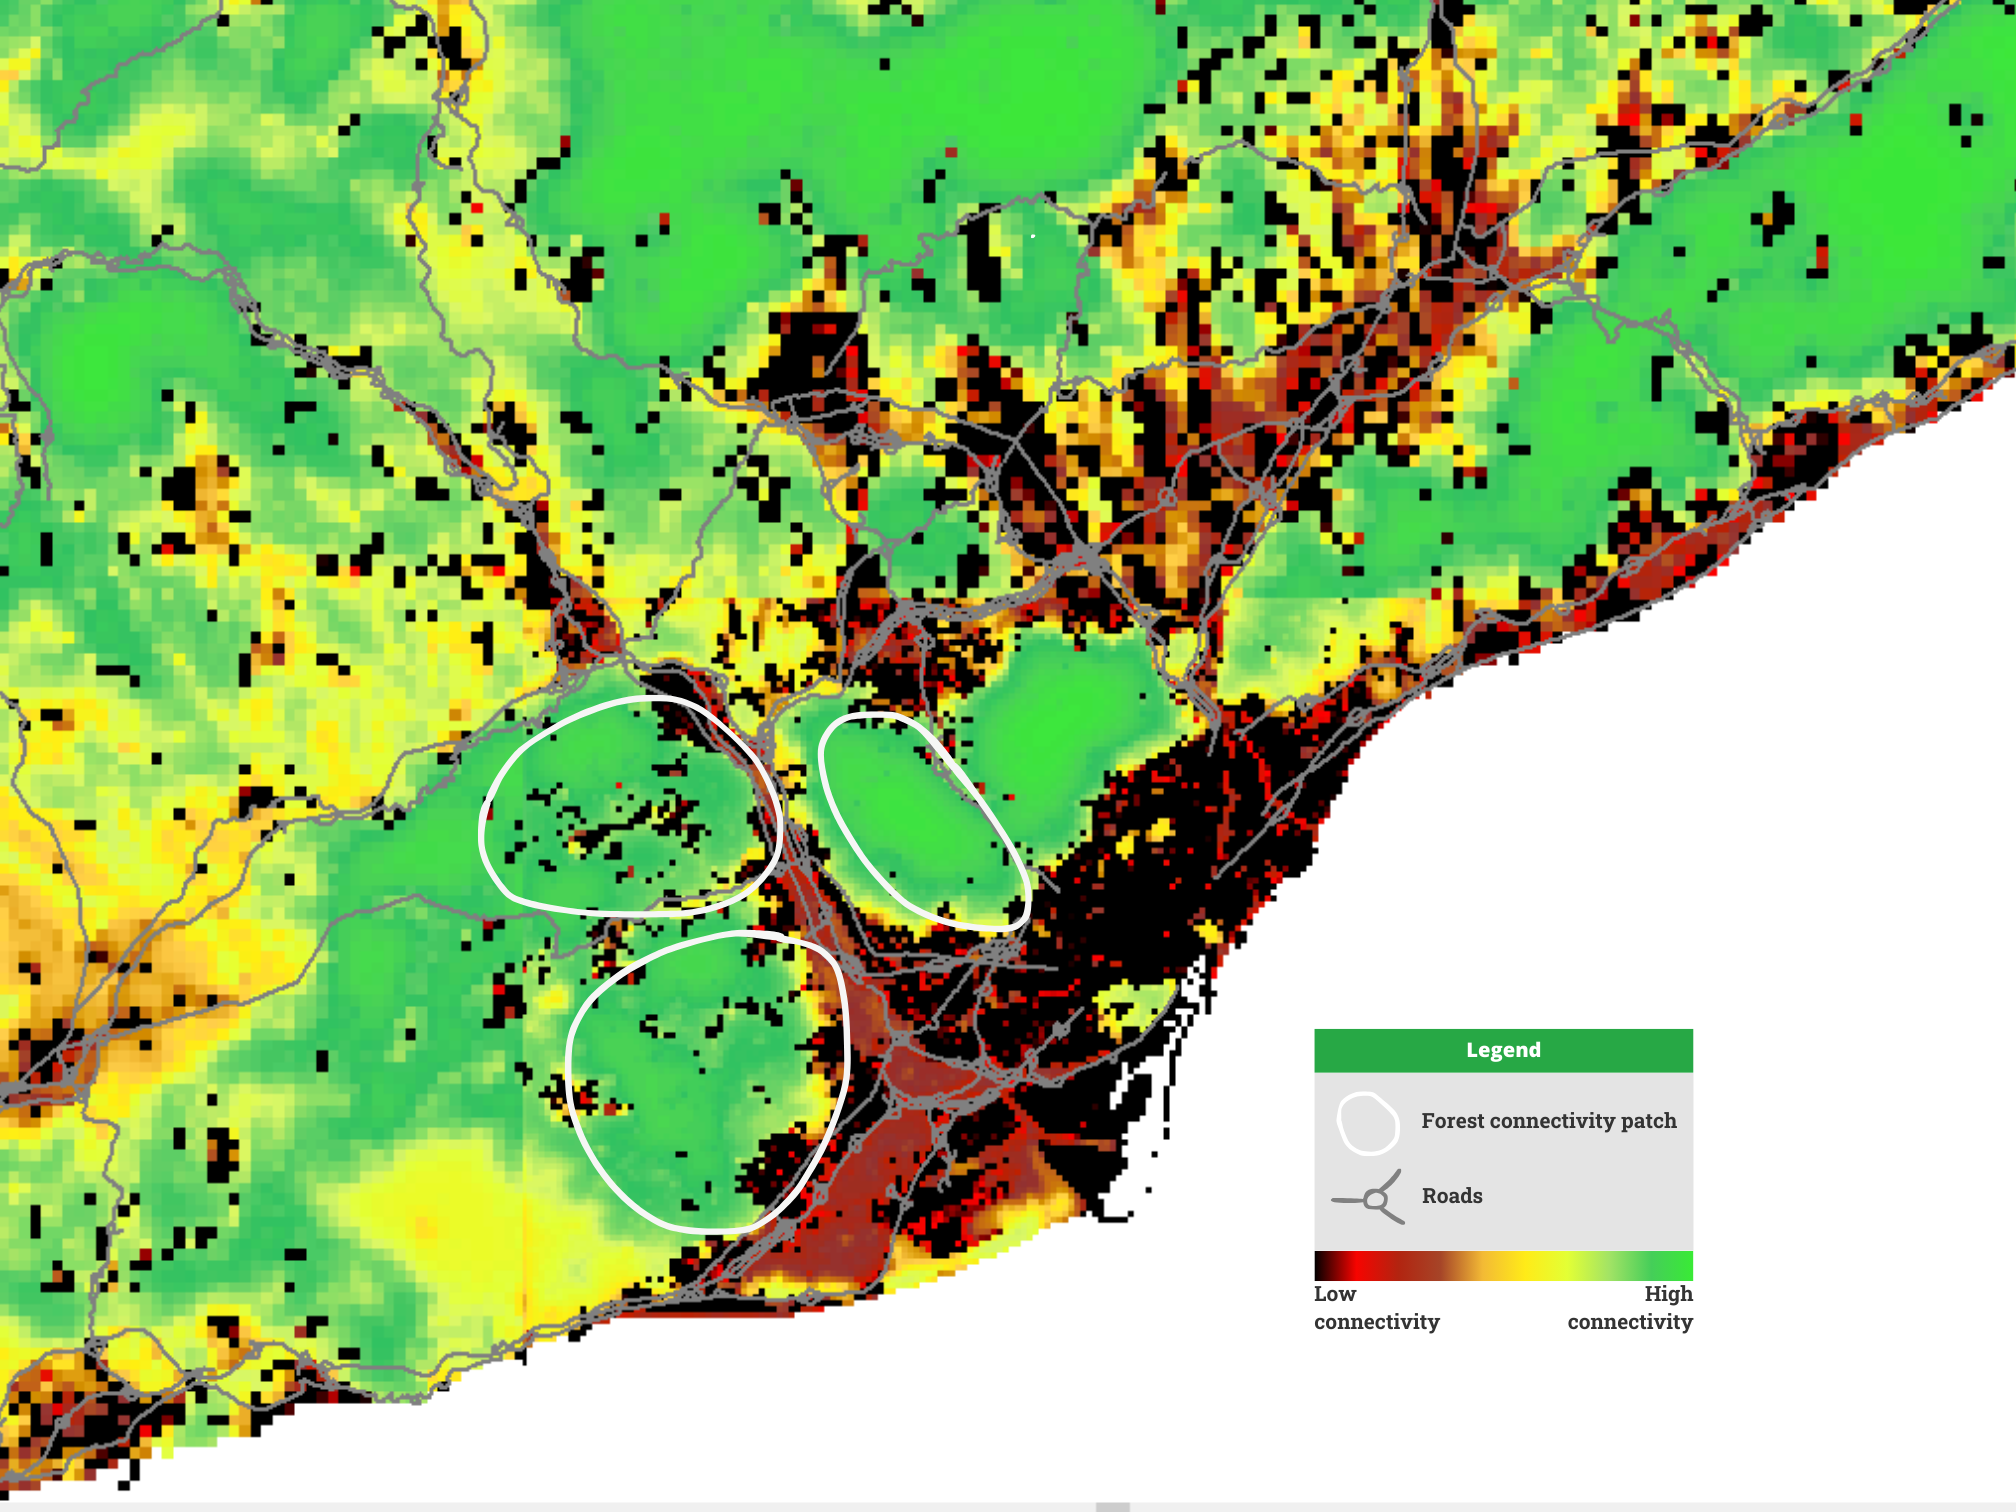
Habitat connectivity affects the distribution of species within ecosystems. It is a key biodiversity indicator and, therefore, a cornerstone in European restoration policies. AD4GD has improved the calculation of habitat connectivity indices in Catalonia using data coming from remote sensing maps, species occurrence observations and IoT sensor data to enhance regional and local actions. Information on threatened species from the IUCN Red List is also considered. The Bioconnect interface gives access to these indicators, improving decision-making at the local level.
Functional landscape connectivity reflects the ability of species to pass through landscape, moving between patches of habitats (Aufrret et al. 2017). Connectivity for animal and plant dispersal is a fundamental consideration for national, regional, and local governmentls in making strategic spatial decisions about protected areas, networks, industrial and residential zoning, agricultural practice regulations, land remediation, etc.
Biodiversity conservation, and ecological connectivity in particular, is a fundamental milestone in global and European policies strategies, from the European Green Deal and the EU Biodiversity Strategy for 2025 to the Convention on Biodiversity post-2020 targets and the Sustainable Development Goals.
Goal 15 aims to “Protect, restore and promote sustainable use of terrestrial ecosystems, sustainably manage forests, combat desertification, and halt and reverse land degradation and halt biodiversity loss”.
Governmental stakeholders need standardized metrics on biodiversity status for international reporting and accessible locally sensitive products that facilitate local policy dialogue.
Approaches to quantifying connectivity vary from graph-based models to remote sensing derived approaches, such as the Ecological Connectivity Index currently used in Catalonia. However it is difficult for regional governments to access the data and services which would allow consistent connectivity metrics across a complex landscape mosaic.
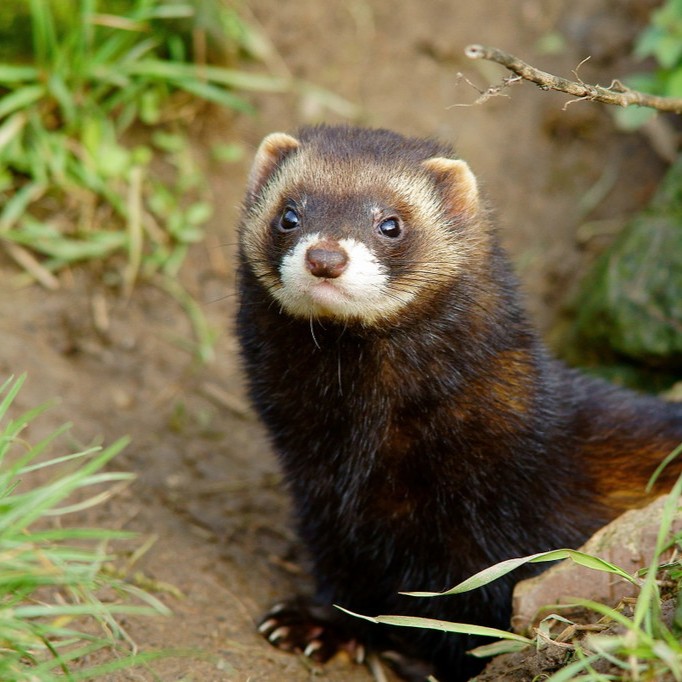
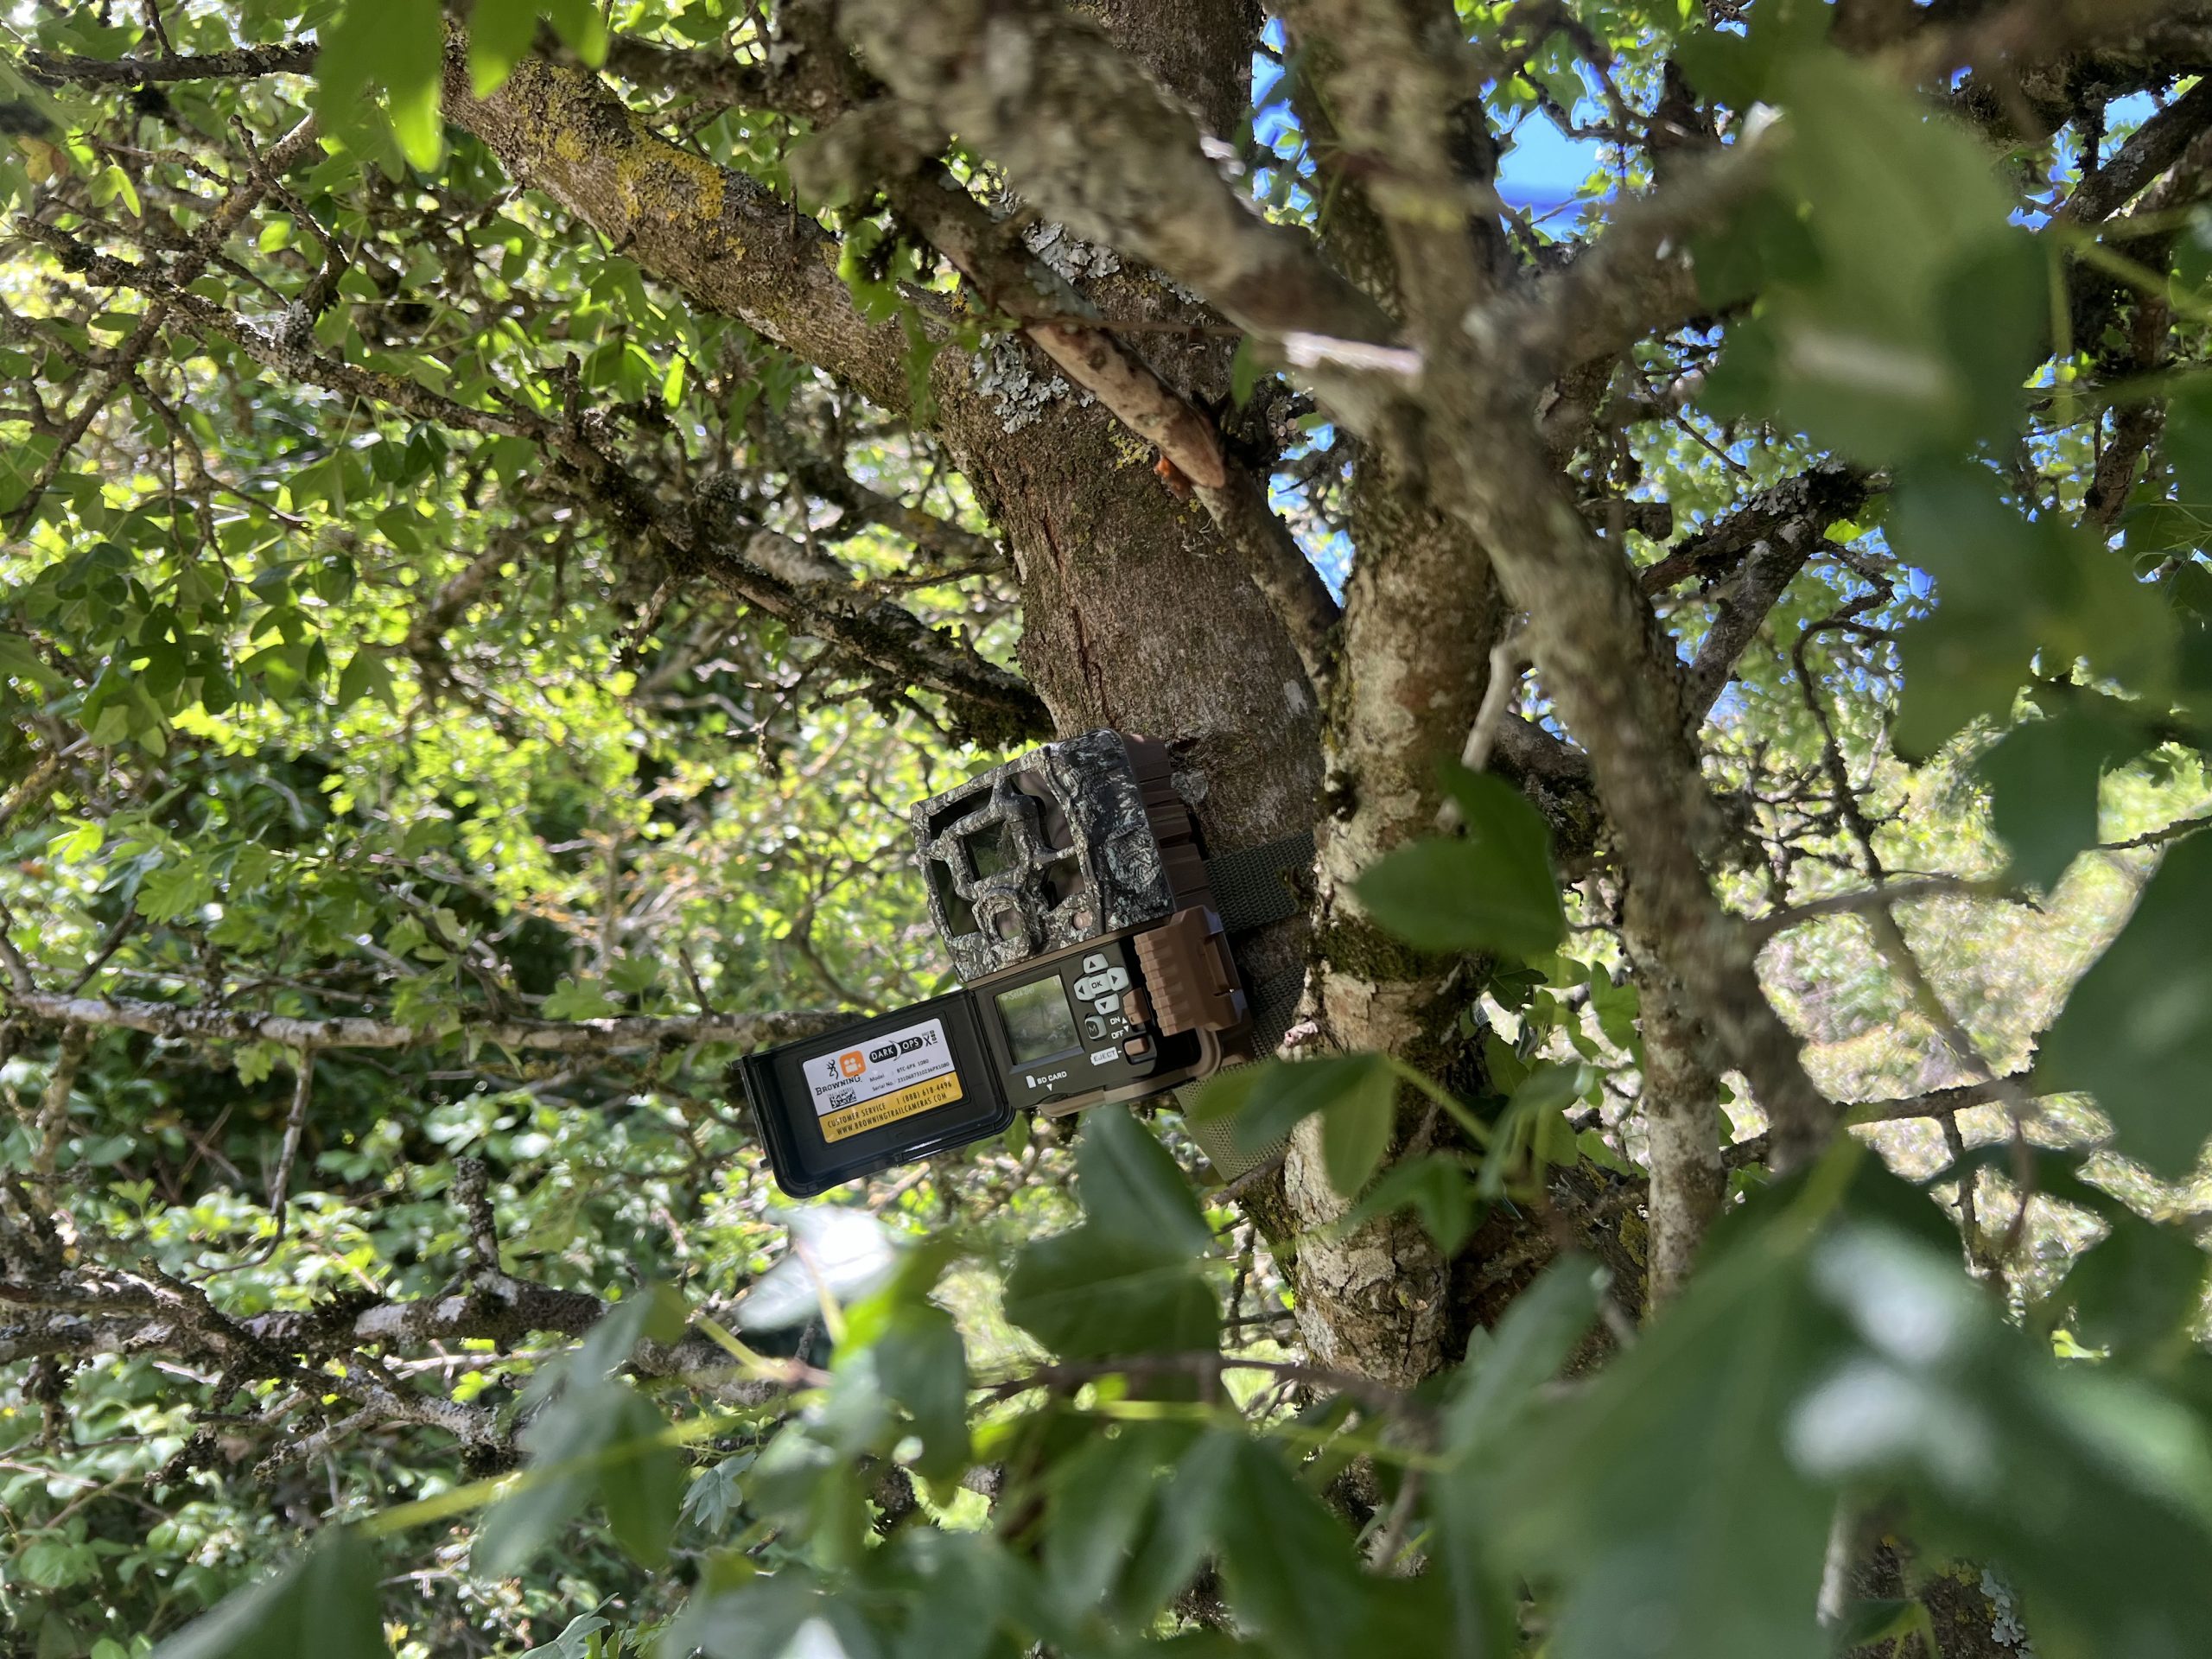
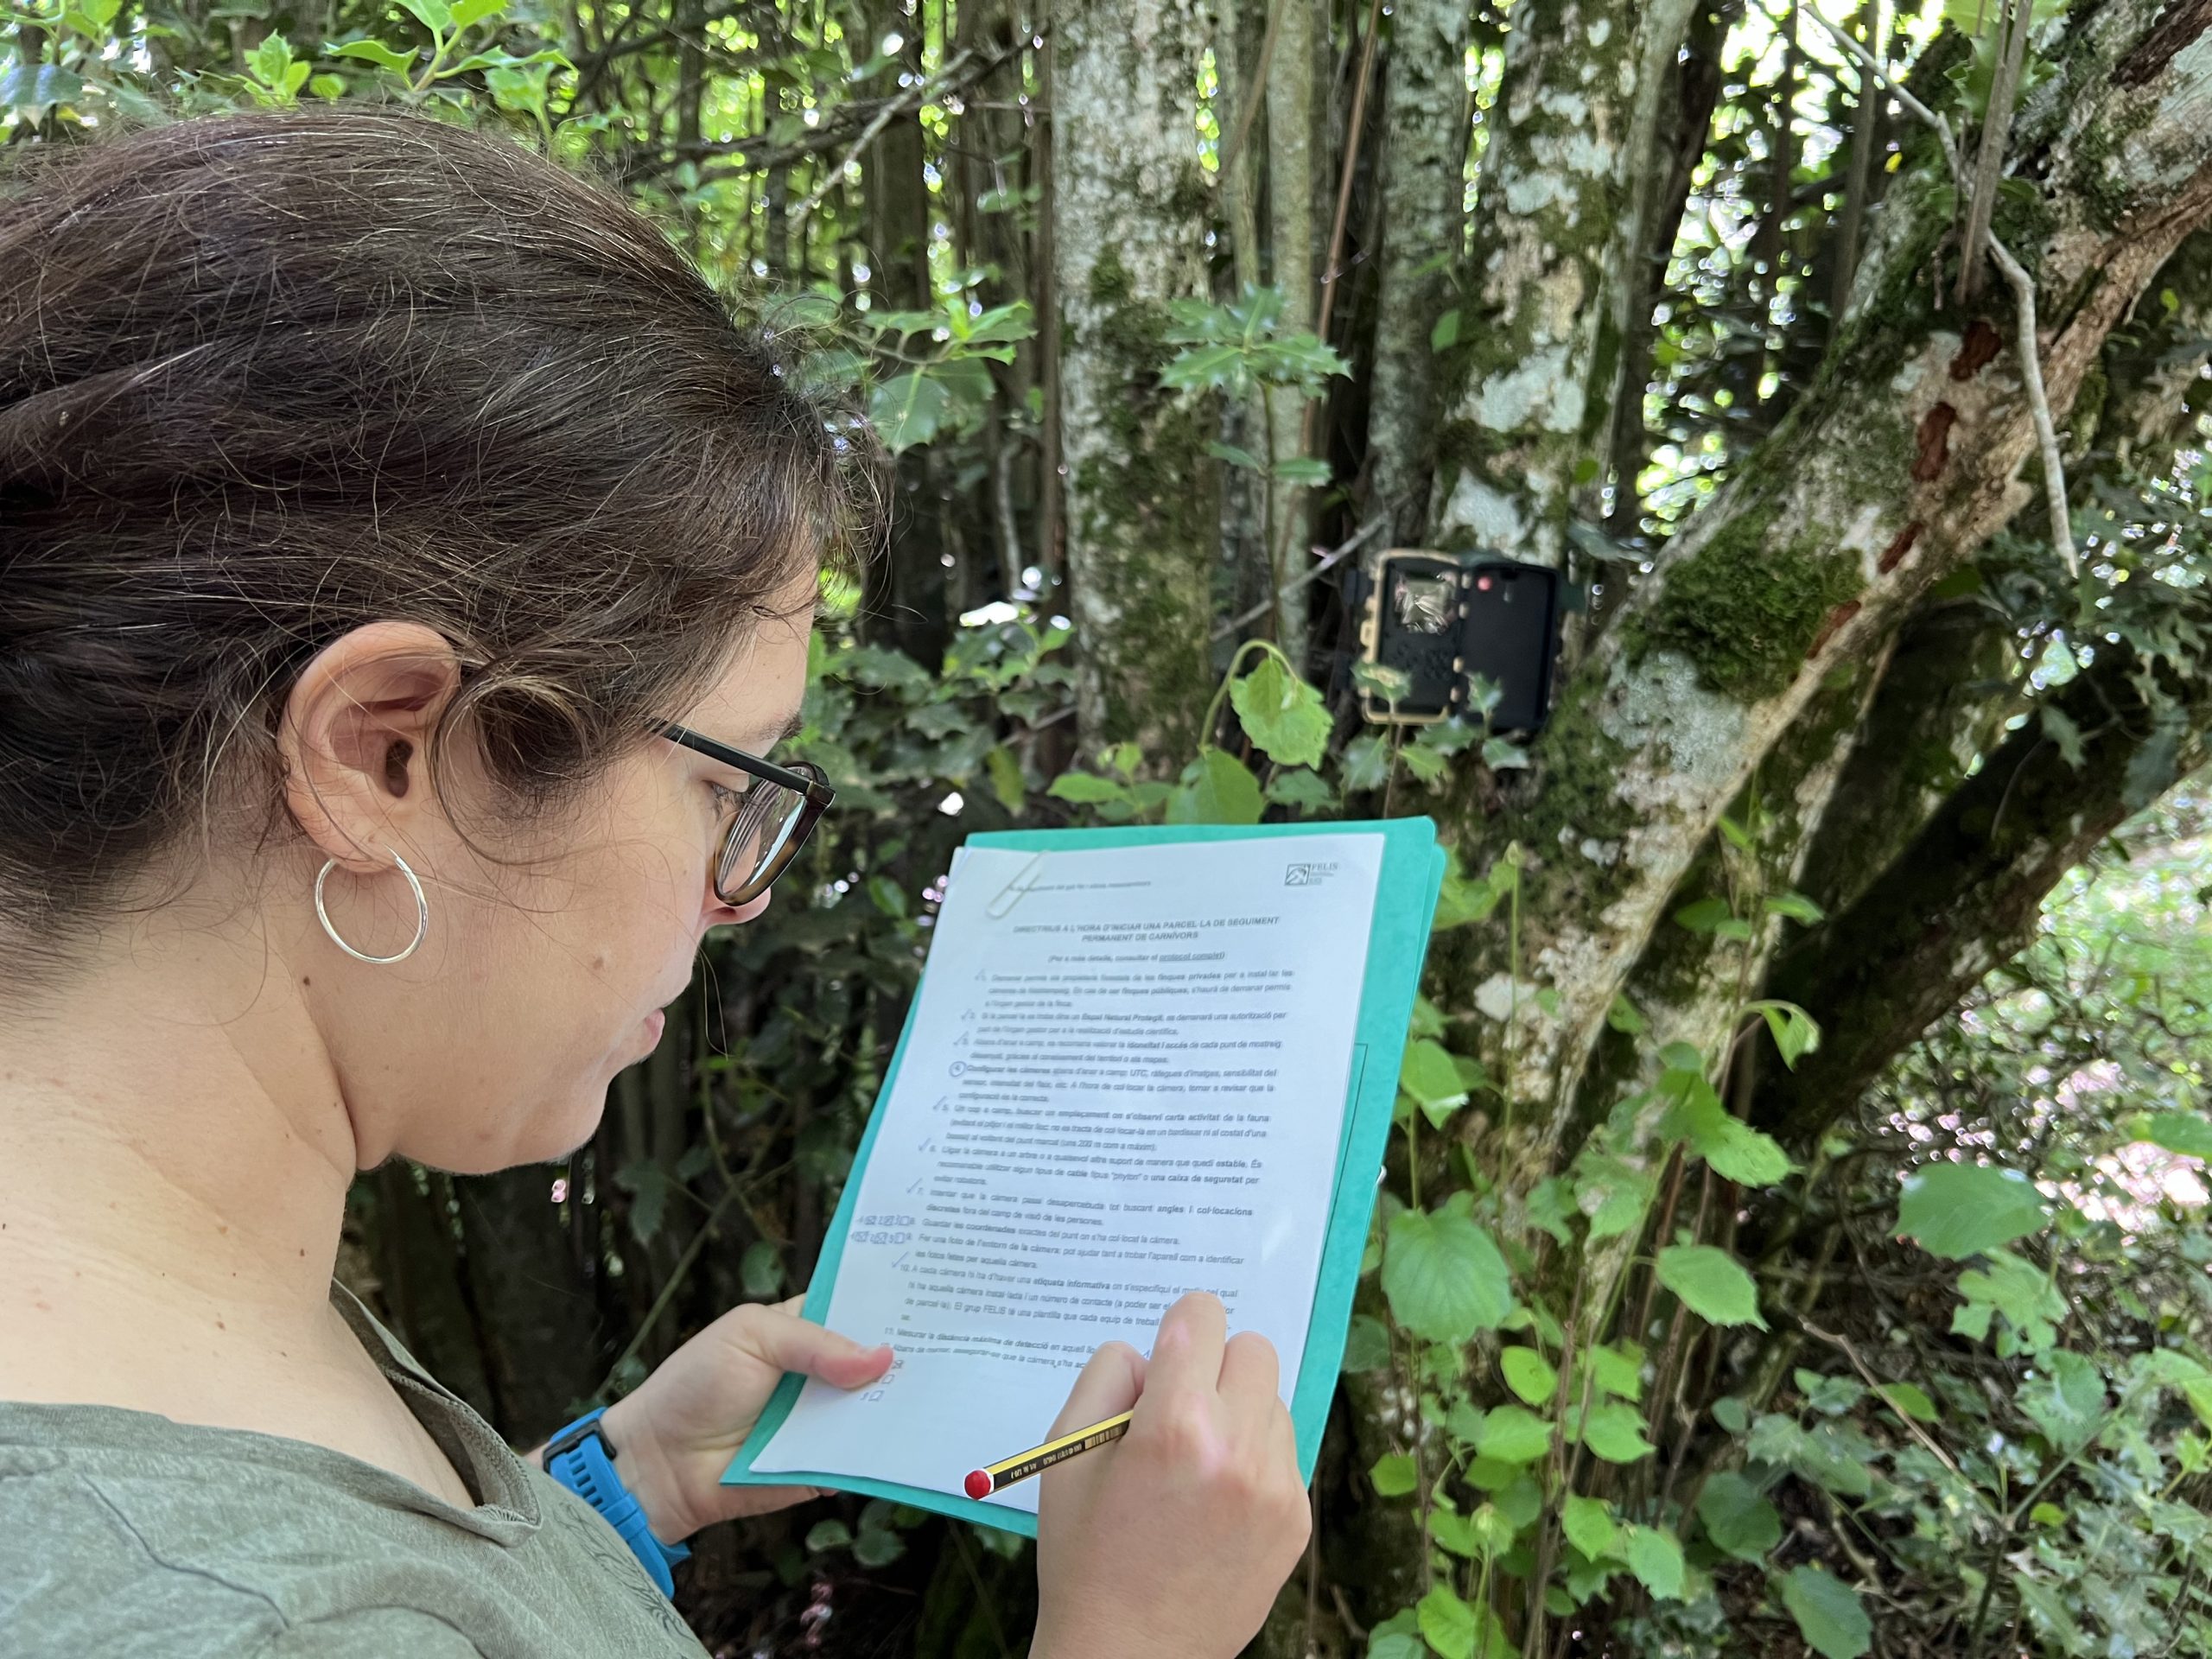
“There is potential for connectivity to be validated with IoT, sensors in the field, and citizen science observations that verify the usage of corridors by some target species. However, the integration of such data into workflows mainly based on satellite and cadastral data is complex and not well supported by existing tools.”
The AD4GD Approach
Enhancing workflows for calculation of funcional landscape connectivity
AD4GD has enhanced the calculation of habitat connectivity indices for Catalonia, considering historial data from 1987 to the present for the main habitat categories, and created methods for predictions. Land use and land cover maps obtained through satellite imagery are enriched with information on manmade infrastructures with data from Open Street Maps and on protected natural areas via the World Database on Protected Areas. In addition, expert knowledge is integrated, as well as data on species occurrence including observations from citizen science initiatives and IoT sensor data on the ground. Information on threatened species from the IUCN Red List is also considered. Two methodologies for connectivity computations have been developed using MiraMon and Graphab.
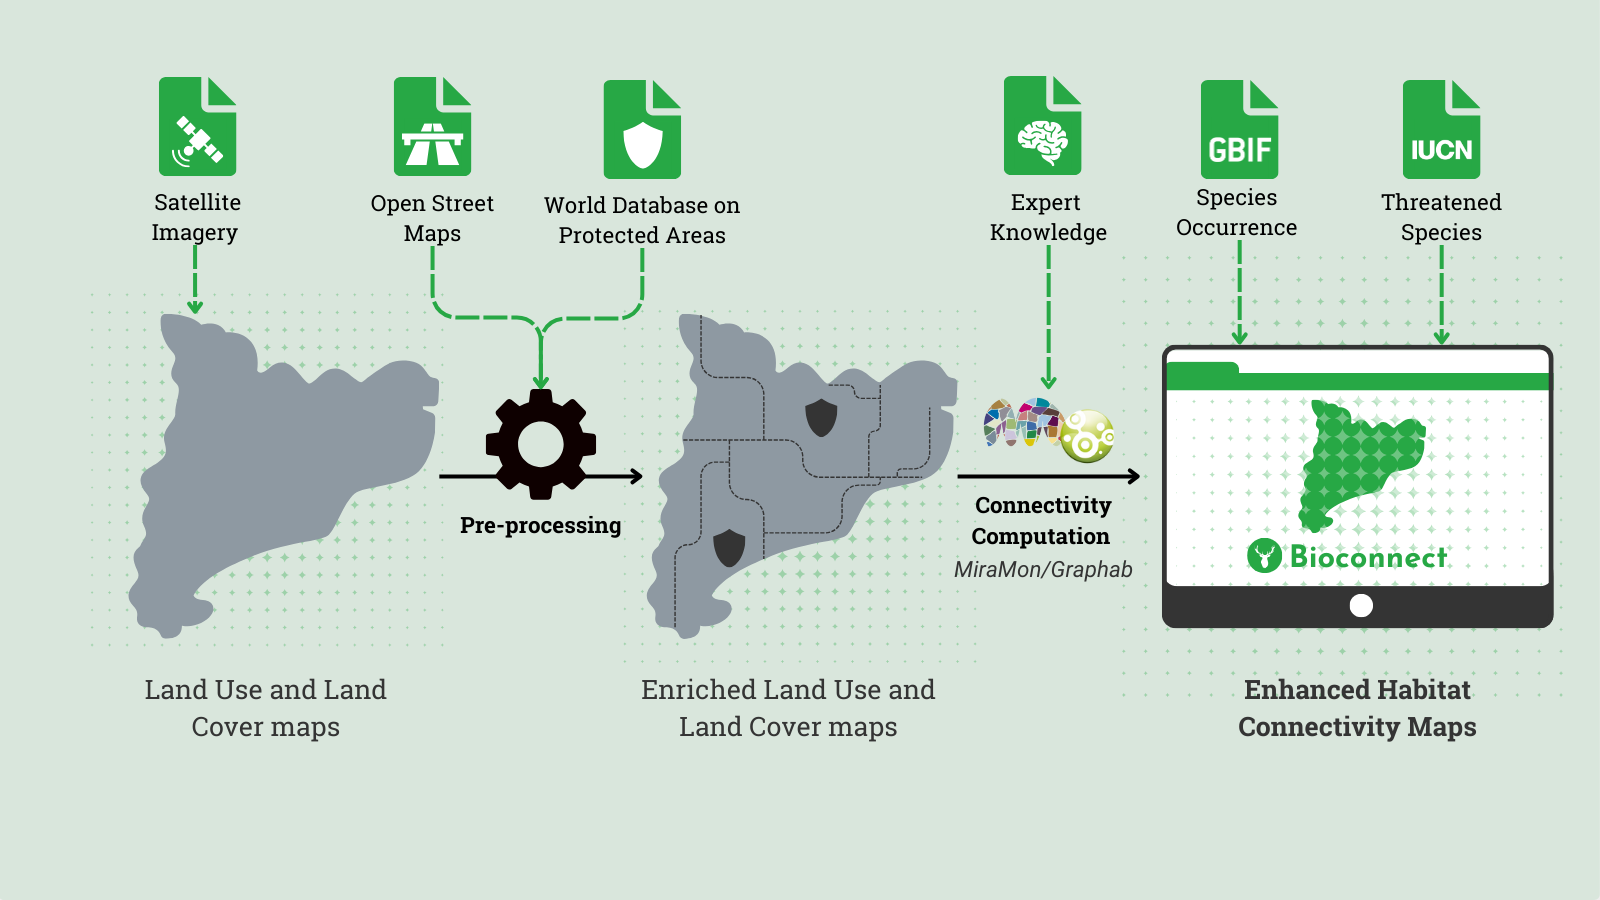
Simplified data flow schema for the biodiversity pilot. Author: Diego de la Vega (CREAF).
Data4land, a tool for pre-processing
Data4Land carries out preliminary analysis of input raster datasets, requests to the REST APIs to retrieve vector datasets from OpenStreetMap and World Database on Protected Areas to enrich land-use/land-cover maps, harmonisation and rasterisation of vector datasets.
Data4Land also extracts biodiversity stressors based on the user configuration to enriches landscape impedance. The processed outputs may be used for subsequent analysis of habitat connectivity in Graphab, MiraMon or other software.
Further information can be found in Deliverable 6.2, the following softwate paper (Kriukov et al, 2025) and AD4GD blog site.
GRAPHAB PROCESSING AND POST-PROCESSING
The developed processing Graphab workflow is formed by a few main components, including Java application, Wrapping main Python script and underlying job, the configuration files defining ecological parameters and commands scheduled to run for each case study and auxiliary Python scripts to harmonise processing outputs, calculate stats, visualise trends, and to access, read, and upload data from/to MinIO object storage.
The Graphab application, along with common commands to calculate habitat connectivity indices, has been implemented on Aston University’s HPC cluster, Nandi, to accelerate processing and improve performance. Read more on Deliverable 6.2 and on GitHub.
MiraMon Processing
AD4GD has developed MiraMon ICT (Index of Terrestrial Connectivity), a stand-alone plugin tool for the MiraMon GIS Software. The original computation of the ICT index was performed pixel by pixel using a large number of sequential batch processing comments, making it difficult to manipulate and execute. The new MiraMon ICT calculates the ICT index more efficiently and significally reducing the execution time.
Dive into the details at Deliverable 6.2 and GitHub.
GBIF2IUCN tool for table enrichment
This tool is used to extract available data for potential subspecies of interest from GBIF, IUCN and ancillary user-defined sources, and enrich it with spatial raster datasets in several steps. Registration is required to access the relevant data from some of the external services like the Digital Observatory for Protected Areas. These were made accessible via our collaboration with the EU’s Knowledge Centre for Biodiversity based at the EU Joint Research Centre (JRC). GBIF2IUCN uses datasets like the species lists, custom conservation information and raster samples and produces enriched tables and ocurrence datacubes. Read more about it in Deliverable 6.2.
Biodiversity Machine Learning (ML) Models
AD4GD has tested machine learning (ML) models to predict future Functional Landscape Connectivity using existing land-use/land-cover (LULC) data, comparing results to those obtained from the MiraMon software. A trained AI model was employed to reduce the computational cost and processing time required to translate LULC maps into ICT values. While models trained on insufficiently large datasets produced inconclusive results, the outcomes for the Forest Connectivity Index were sufficiently robust, achieving a drasctic reduction in computation time, from weeks to minutes. This suggests that, with adequate training data, AI models can serve as a viable and highly efficient alternative to tradicional approaches when evaluating the implications of modificating the landscape.
An in-depth study of accuracy and time take for the models is depiected in Deliverable 5.2.
Leading partners:

Useful links:
References:
> Lazcano, R., Di Pietro, F., García-Gómez, J., Galiana, M., Berwanger, K., Mebus, L., Crettaz, C., Zamzow, M., Serral, I., & Kriukov, V. (2025). AD4GD D5.2 Artificial intelligence resources for Earth system modelling. Zenodo.
> Bastin, L., Kriukov, V., Lush, V., Serral, I., Hodson, T., Borger, C., & Zamzow, M. (2025). AD4GD D6.2. Pilot Technical Implementation Planning, Implementation and Assessment Report. Zenodo.
> Kriukov, V., Rahman, R., & Bastin, L. (2025). Data4Land: How to enrich land-use/land-cover with historical vector(s). SoftwareX, 31, Article 102226. https://doi.org/10.1016/j.softx.2025.102226
Bioconnect, a user-centered interface
All the data and indices are displayed in a graphical user interface called BioConnect, co-developed with stakeholders using a Human-Centered Design approach.
The interface allows users to explore various layers related to land use, bioconnectivity indexes, species distributions, infrastructure, and historical datasets focused on the Catalonia region. BioConnect also equips users with the ability to create scenarios by simulating changes in land use.
BioConnect is currently only available in English. To access the platform, please create an account by providing your name, email and password. Then, log in using your credentials.
Would you like to learn more?
A new tool to enrich land-use/land-cover datasets with OpenStreetMap and ecological data: Data4Land
Data4Land is a tool that helps to calculate more detailed species distribution models, habitat suitability maps, compute habitat connectivity or urban heat islands effects, among other applications.
Earth Observation as a key tool for monitoring and managing Urban Green Spaces, insights from the 8th Mediterranean Forest Week
The AD4GD project took part in the 8th Mediterranean Forest Week showcasing a poster on Terrestrial Habitats Connectivity and participating in a panel session on Green Cities for Adaptation and Resilience.
Terrestrial Connectivity and Digital Twin ready data available for the Green Deal Data Space at the IGARSS 2024
AD4GD showcased an oral presentation on terrestial connectivity based on Landsat/Sentinel Land Cover Classes as a biodiversity indicator and a poster on Digital Twin ready data for the European Green Deal Data Space.
Stay tuned with us!
We share all our news & events in our newsletter