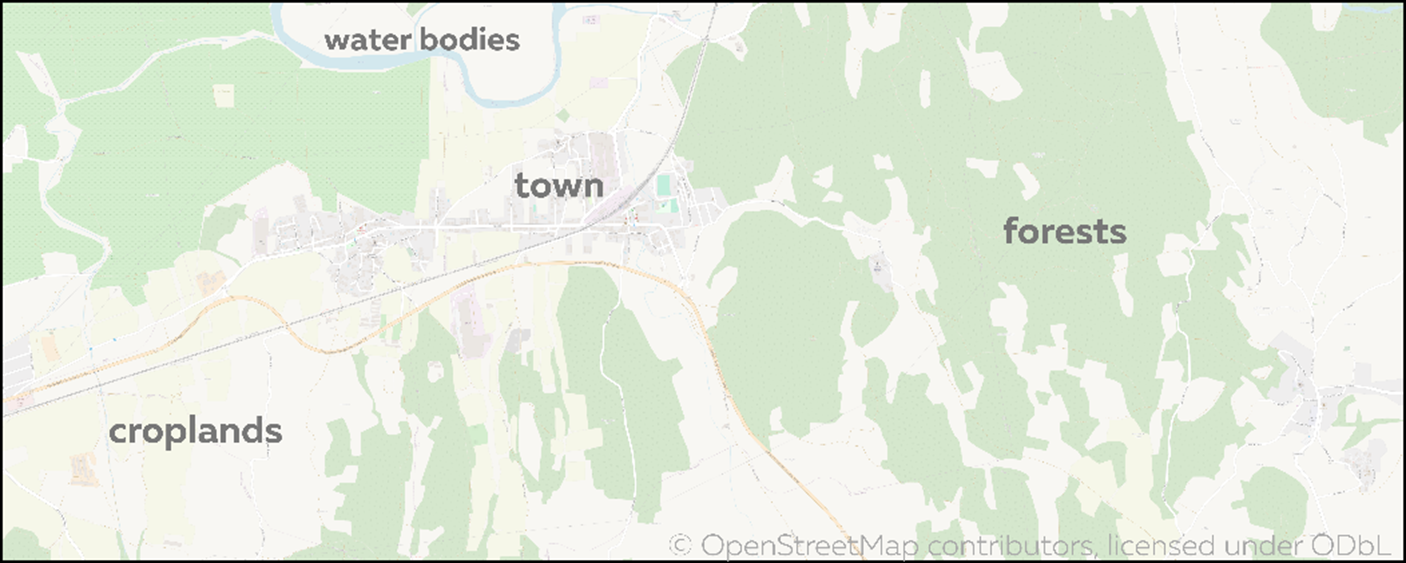
Many of us use Google Maps or similar portals daily, which illustrate, amongst others, settlements, forests, and croplands, shown on the map as polygons of green, blue, beige and other colours. These mapped elements represent land-use and land cover characteristics. Human-transformed areas are usually classified as ‘land use’- for example, residential districts, industrial clusters or transport interchanges. On the other hand, natural or semi-natural ‘land covers’ might include areas of forest, grassland, fen, shrublands, etc.
Land-use/land-cover maps (by its acronym, LULC) can be used for multiple purposes:
- spatial planning;
- analysis of habitat degradation, deforestation, desertification, and habitat restoration;
- urban footprint studies;
- assessments of ecosystem services (such as carbon stock, flood mitigation, pollination etc.);
- agricultural monitoring.
Currently, there are many well-known LULC datasets, for example, World Cover or Corine. These cover a range of different timeframes and geographic areas, and they have different granularity (spatial resolution) and land-use/land-cover classification.
But, what if the LULC datasets you can access are inconsistent, incomplete, or do not cover the spatial features you are interested in? Well, that happens regularly – if not almost always. For example, imagine you want to assess the trophic quality of lakes, but the shoreline is obscured by dense vegetation! If you are lucky, you might have access to supplementary data, such as lake boundaries, generously provided by the local government… But what if you don’t?
You can always use the OpenStreetMap portal, which describes… almost everything in the world, and is continuously updated by regular users from multiple sources. However, the OSM database might be technically challenging to access. To overcome this technical barrier, we have developed a Data4Land tool.
Data4Land provides the OSM database, allowing users to choose between them: Ohsome and Overpass requests. But if you don’t have time to explore the technical details, don’t worry – there is already a default parameter to access data. Researchers and fans of nature can also access the World Database on Protected Areas via Data4Land tool, if they are registered users on Protected Planet. This database contains records of terrestrial and marine protected areas with different ranges of protection covering 245 countries and territories throughout the world. Finally, these harmonised data are ingested into the input LULC dataset using Data4Land. The enriched dataset can be used for further spatial analysis.
What if you have a time series of land-use/land-cover datasets, for example, covering Catalonia (Spain) in 2012, 2017 and 2022. Data4Land also allows enrichment of these multiple timesteps with OSM features which existed at the corresponding point in time, to detect change dynamics.
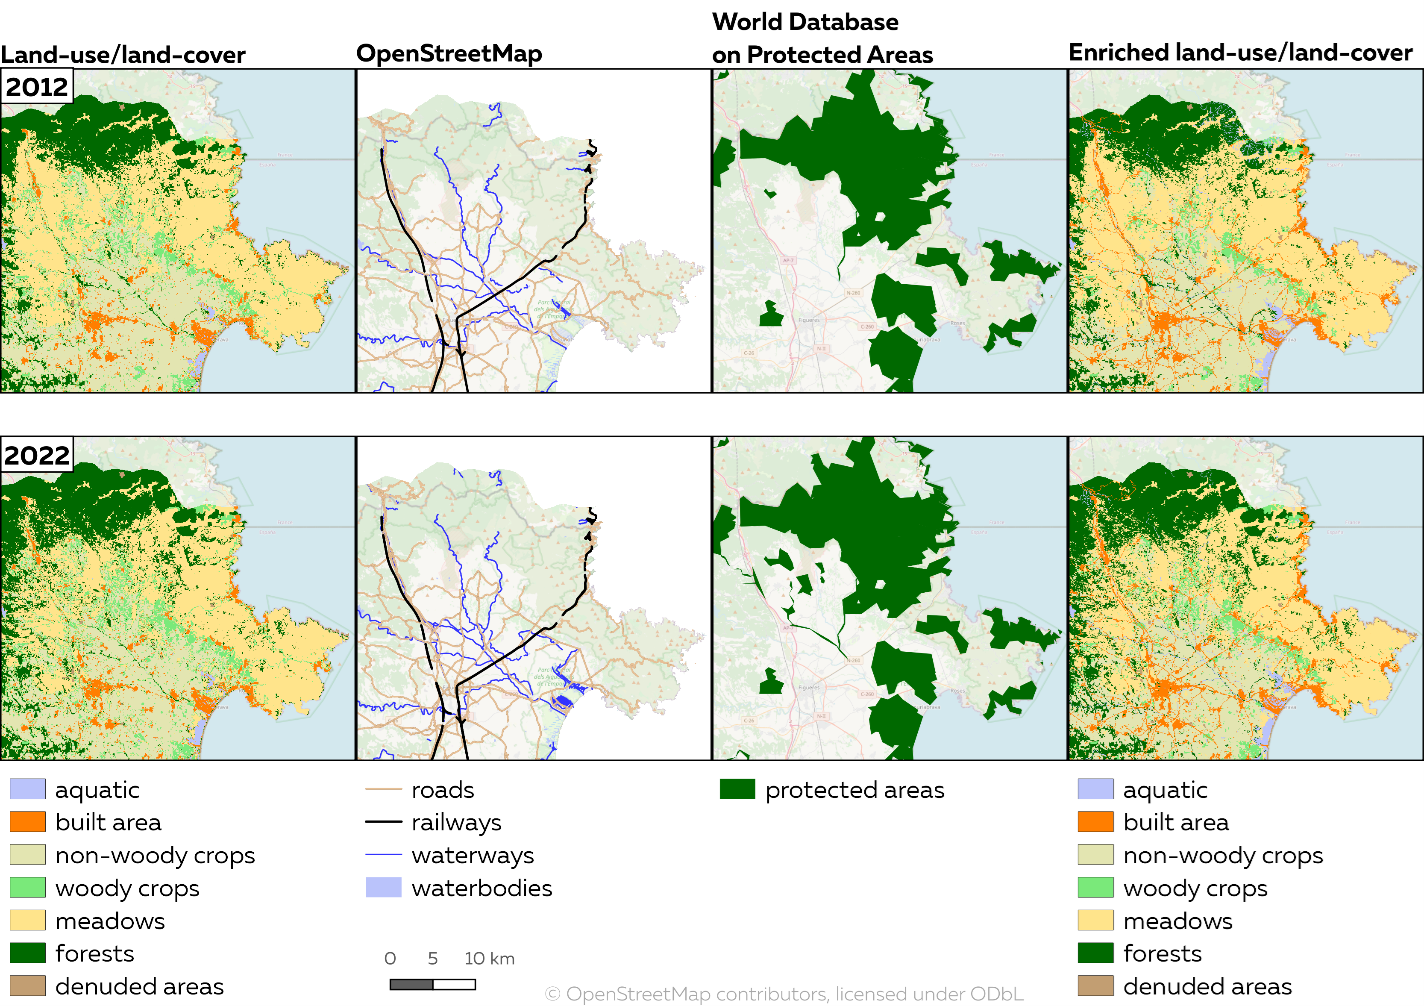
Input dataset (land-use/land-cover), other data sources and output dataset.
If you are a true fan of biodiversity, you should check out the ‘recalc-impedance‘ component of Data4Land . It allows researchers to define ecological parameters that describe how organisms experience a landscape, such as habitat suitability and biodiversity stressors. Once configured, Data4Land computes the landscape resistance, or impedance, simulating the ease or difficulty of movement for terrestrial animals or birds. This can be very important in understanding whether a species can colonise new habitat or can respond to habitat shifts caused by climate change. The user can also set their own parameters to define how biodiversity stressors, such as roads or pollution sources, affect habitat suitability, drawing on domain knowledge or personal experience to choose the most appropriate values. Is the impact exponential or proportional? How quickly does the effect fade as we move further away from the stressing feature? For example, one could simulate how the impact of roads on Pine marten (Martes Martes), declines as distance from those roads increases.
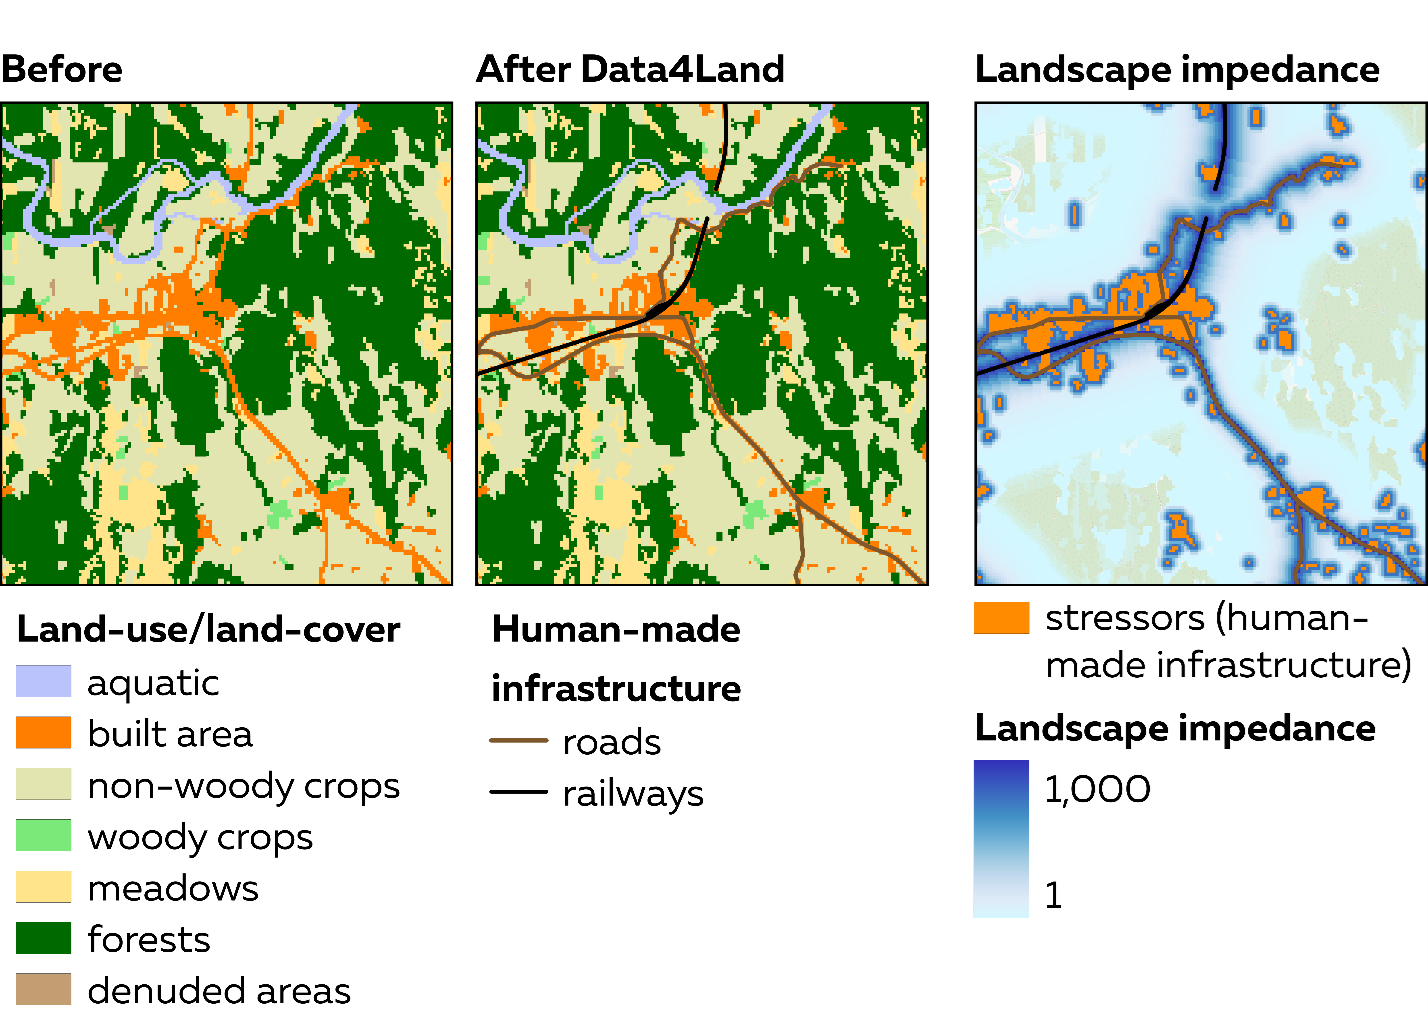
Application of Data4Land tool to habitat connectivity calculation. If you do not consider this road, the forest seems to be a one big connected and diverse habitat, but it is not the case.
How can Data4Land be used for hands-on applications?
In multiple ways:
- LULC datasets are important in biodiversity studies to calculate species distribution models, habitat suitability maps and compute habitat connectivity. This is the main aim of the biodiversity pilot in the AD4GD project.
- Urban heat islands are primarily caused by human-made heat sources, such as roads and industrial structures. These sources are not always easily distinguishable in satellite images, but OSM data can help identify them and make sure that they are represented in the dataset.
- Rivers and streams are not always easy to delineate from satellite data. OSM can also help to fill those gaps, so the visualisation of basins could become more granular and accurate.
So how far back in time can we look? That is a very relevant question, because OSM has only been populated with data since 2005. Regarding the World Database on Protected Areas, some of them were established even in the 19th century, but that data considers only the legal status, not real-world changes in land use. Therefore, the Data4Land tool makes it easier to incorporate these two important data sources into your maps, so long as you recognise these limitations in timeframe.
If you have an interest in environmental studies or technical experience, please feel welcome to familiarise yourself with the Data4Land software on Github and Zenodo. The Data4Land tool may be useful for a wide range of users at local and regional scales: researchers, spatial planners, environmental consultants, developers, government administrations, etc. However, we value any feedback from users to refine the tool and meet the actual demand!


